When your campaign is live, your ad is shown to the targeted audiences. Statistics how many times your ads are shown (impressions), clicks, views, completions, etc. are collected daily.
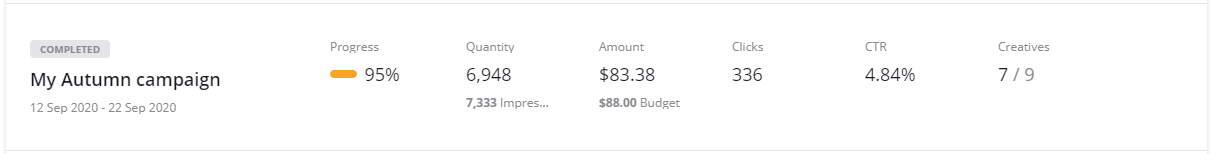
In the campaign list you can see your original Budget, Amount delivered, Quantity, Impressions, Clicks and CTR (click-through-rate).
The daily statistics are calculated into Performance charts which are updated continuously.
Statistics are collected from creative level all the way up to totals for all your campaigns.
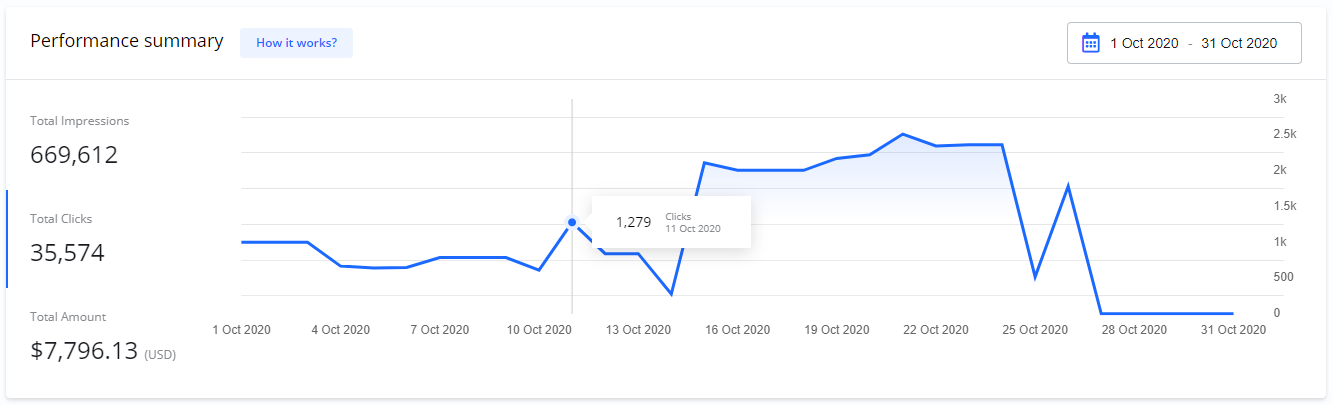
Performance summary
On your Dashboard > Performance summery you get an overview of total statistics for all your campaigns.
Total Impressions
How many times your ads have been shown.
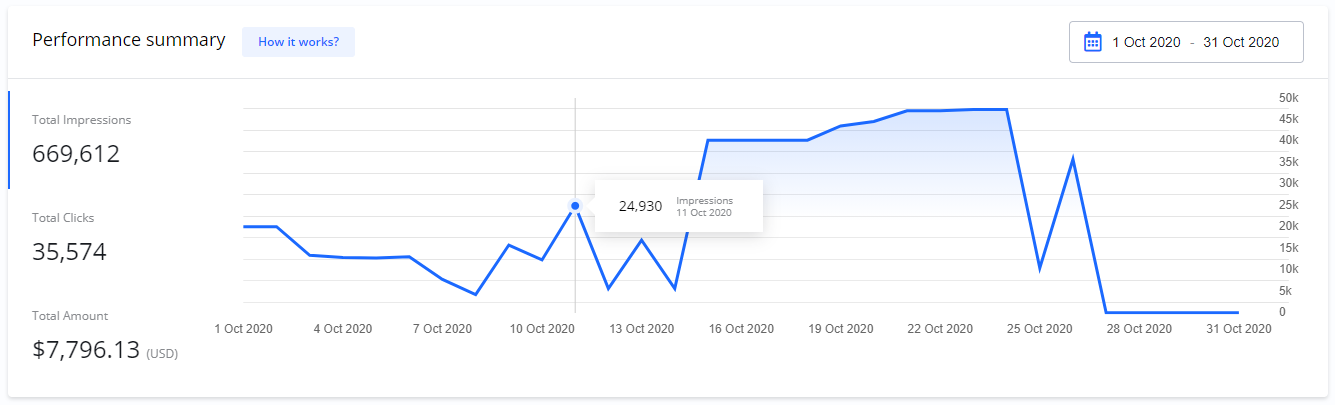
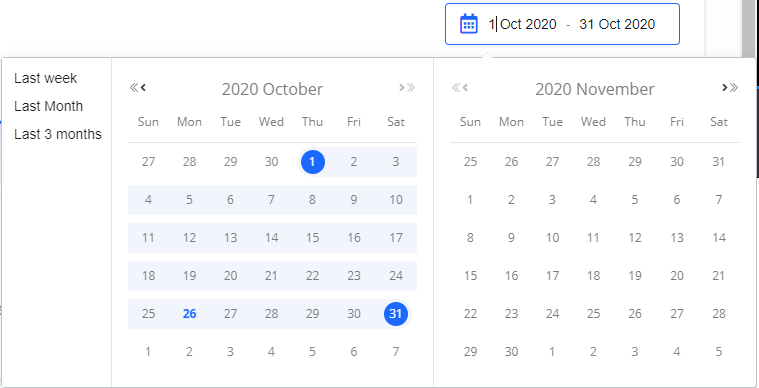
You can filter the chart on Start and End dates.
If you move your mouse over the chart you can see more details.
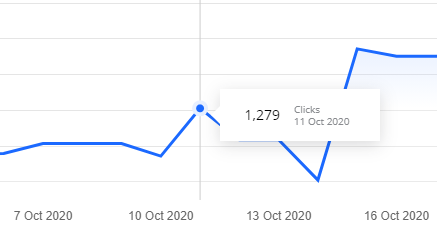
Total Clicks
Number of times people have clicked your ads.
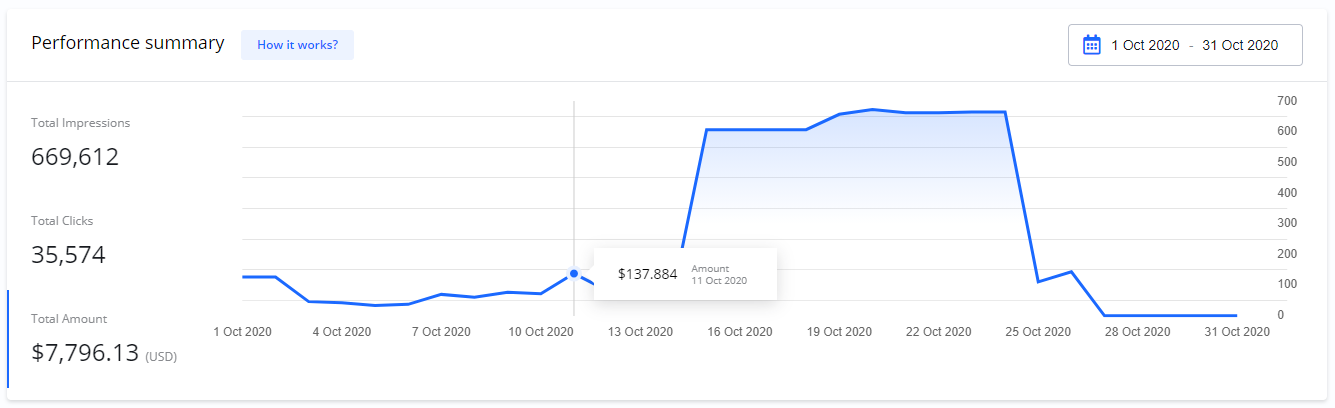
Total Amount
Total amount delivered.
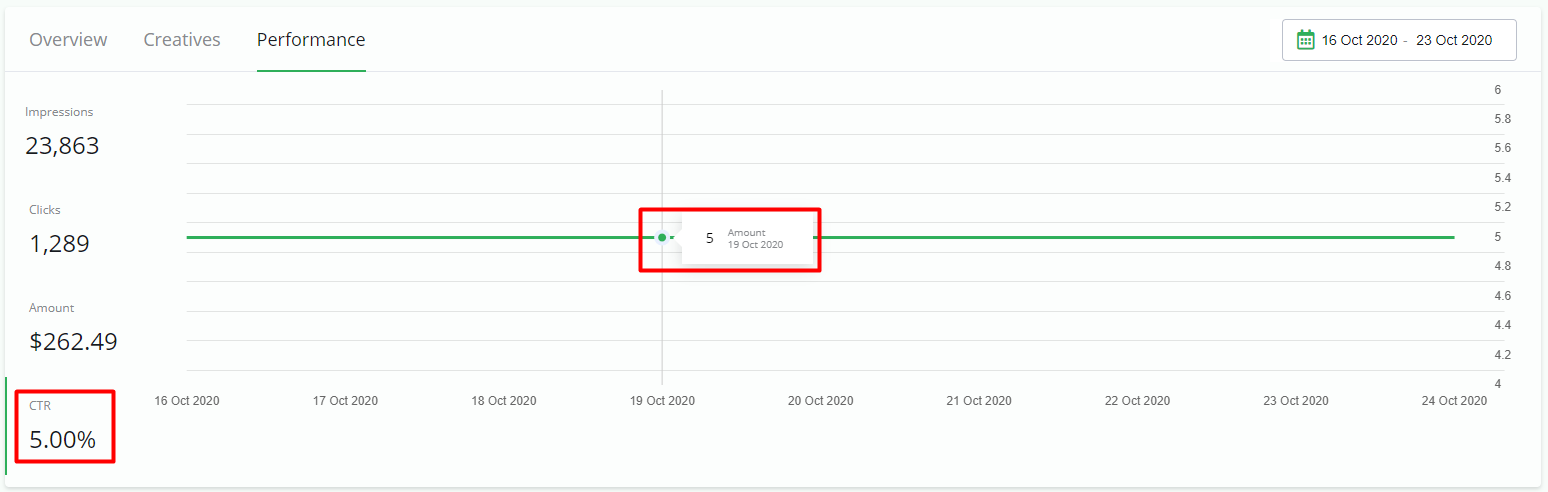
Campaign performance
On Campaign details > Performance you find the statistics for each campaign.
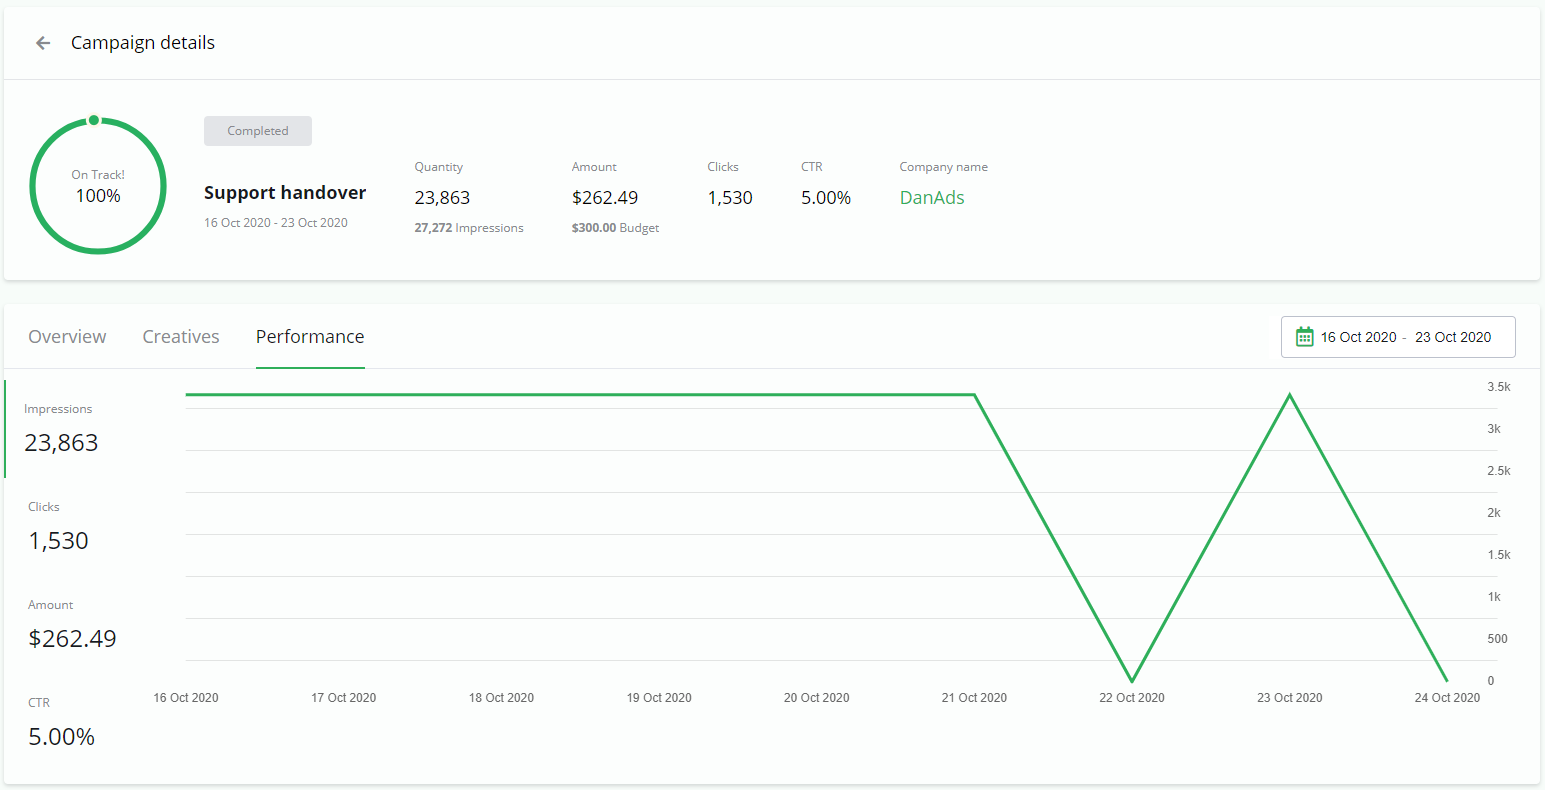
CTR - Click-Through-Rate
In addition to Impressions, Clicks and Amount, the campaign details show you CTR (Click-Through-Rate).
CTR is the percentage of all the people who saw your ad and clicked on it. CTR is calculated as Clicks/Impressions.
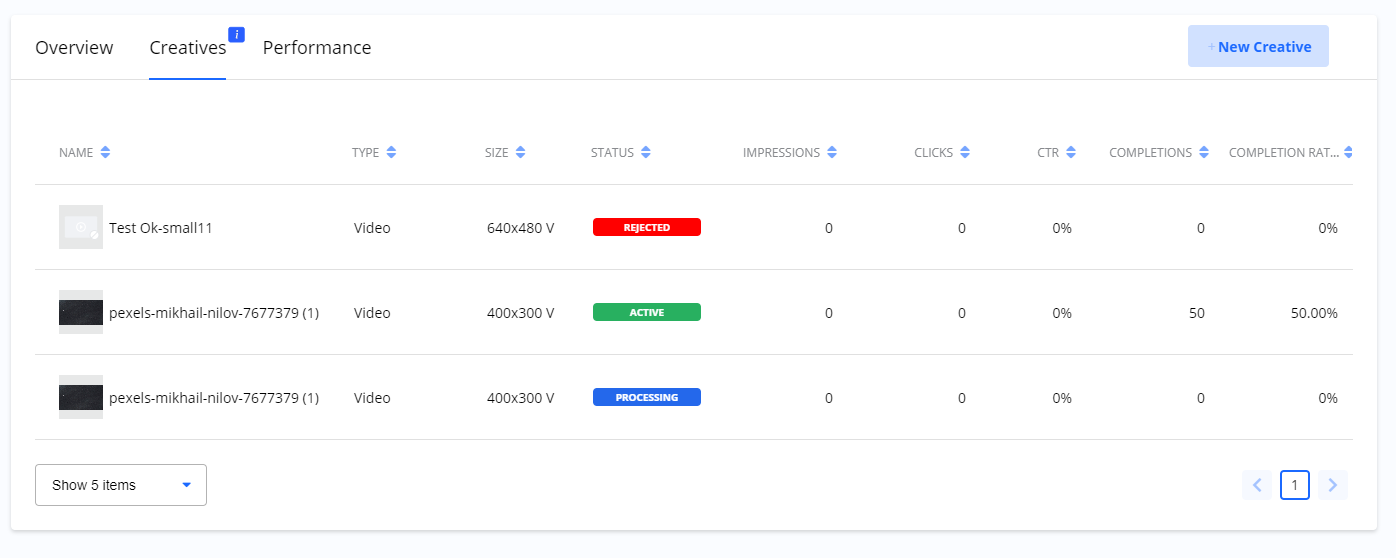
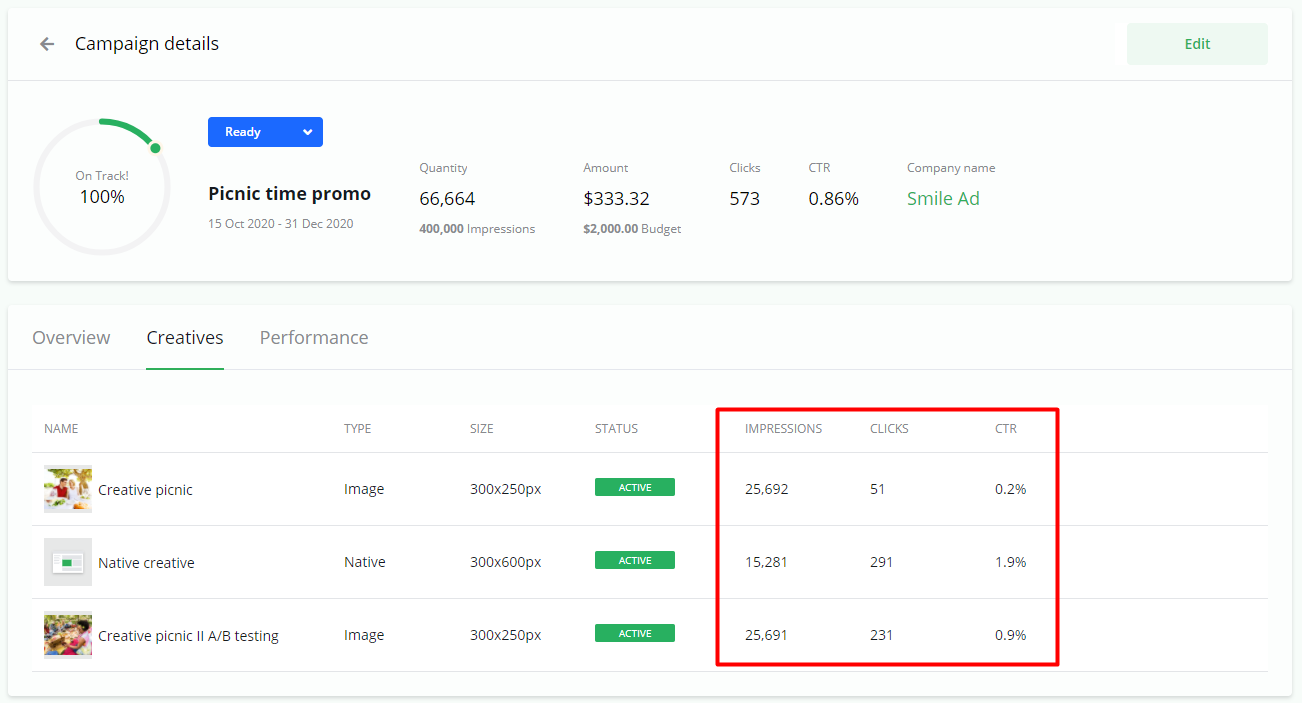
Creatives statistics
Campaign details > Creatives give you an overview of statistics per creative.
You can use this information to see which of your creatives performs better.
Statistics for video creatives
Statistics for video creatives includes the statistics for online ads Impressions, Clicks and CTR plus:
-
Completions
-
Completion Rate